Information Graphics through a 30,000‑Year Lens
Information Graphics through a 30,000‑Year Lens
- 1. Cross-cultural and cross-media information onf Grapics from simple to Complex
- 2. Principles and affordances of visual systems that likely survive interpretation
- 3. Unusual, concise, elegant, and surprising techniques for 2026
- 4. Constraints of long-term preservation that attack meaning first, not files
- 5. Practical user guide for designers and archivists in 2026
In art school, a teacher once made a significant impression on me through a simple assignment. Consider the following design problem:
Imagine you work for a corporation that has discovered a solution to global warming, world hunger, or something equally devastating. The byproduct of the process solving this problem is a giant, toxic waste dump. A board of top minds have been assembled to decide how to dispose the waste: it would be buried deep, deep underground — so deep, in fact, that it would not be expected to resurface until another 30,000 years passed. Your job is to design the warning sign for the lid of the dump, to warn the inhabitants of Earth in this distant future. We have no idea what language they will speak, what their culture and customs will be like, or even if they will be human. How would you design a sign that communicates the very important message to not remove the lid of the underground vault?
Information graphics work best when structure is compressed into into perception. The mind quickly recognizes quantity and relationship when it is represented by count, position, and sizing. Typical left-brain activity like calculating and analyzing are secondary to what is absorbed intuitively by the "right" brain.
For future civilizations, it is definitely less important how attractive this sign is, because the graphic contains a dire warning whose meaning is crucially understood. Choose encodings with posterity, with meaning that survives an indefinte period of time into the future, and decodable by an unknown intelligence. Taking on an imagined perspective 30,000 years into the future forces us to recognize the nature of reality—that both things are true! Some ideas will pervail and others will perish but for reasons that are both vital and mundane. Geometry and physics continue to have perceptual salience and remain legible even when language and culture vanish. Visual representations on which we have hung our hats (charting, iconograpy, design systems) are significantly more frail, because they depend on conventions of now. Without the context of the present, ideas dissipate into decorative noise and norms become hideous aberration (quicker than you can say "Puff Daddy").
Durable strategies come up when examining current and historical records:
- repetition representing quantities
-
Isotype pictograms
- spatial positioning indicating magnitude
-
charts/maps topology that showi connection networks descriptive redundancy legends, scales, reference units
They persevere because they piggyback on an inherent mammalian ability to detect positional difference, to intuit natural grouping, and to recognize symmetry, continuity, and motion sub-consciously. As long as future intelligence retains the same, these strategies remain valid.
According to a study published on behalf of Taylor & Francis, Ltd. for the American Statistical Association in September of 1984, graphical perception among diverse populations showed that position on common scales (placing data points across a single, shared axis) are perceived more accurately than formulaic encodings like length, angle, and area represented graphically (geometry). Further, Feature-Integration Theory, as described in the 1980 article in Cognitive Psychology by Anne M. Treisman and Gary Gelade, posits that some graphical features “pop” for cognitive recognition, like distinct hues, orientation, or motion. Both observances signifcantly useful to consider in Graphic Design, but the later theory less so because it depends on current context.
Designers and Archivists in 2026 must be vigilant in awareness for the true cost of features like interactivity, animation, and platform-specific stylings. These features are inherently luxurious, and should always be treated this way. Do not place all record in luxury resources. Treat self-describing, redundant encodings, and open-format artifacts as primary. Beware of false confidence! Learn to recognize it and weed it out. Standards and preservation frameworks like OAIS, WARC, and PDF/A coupled with the principles and practices of fixity, replication, and emulation do wonders bar are not magical preservers of meaning. Meaning survives only when context is preserved deliberately.
1. Cross-cultural and cross-media information onf Grapics from simple to Complex
A 30,000‑year observer will not care whether something was called an “infographic.” They will care whether the artifact reveals invariants, most important to the subject of graphical meaning for posterity, invariants are, "…functions, quantities or properties that remain unchanged after undergoing various transformations." (see Invariants: The Mathematical Way to Look at the World,"2019"). Invariants contribute “physics” to the study of information graphics, adding perceptual and physical properties likely to survive cultural and linguistic change.
|
Some of the most intriguing examples are described below in brief and share a common thread of being robust encoders for information and resistant to loss. |
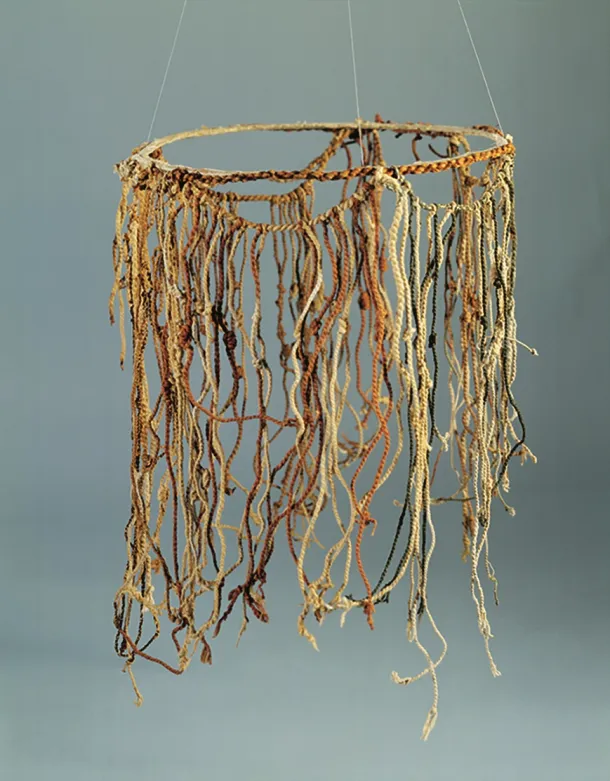
1.1. Case Study #1: Khipu Trandition, Andean Mountain Range, South America
The Andean khipu traditon for using Knotted, tactile, and data-dense records was documented by UNESCO’s Memory of the World database. It describes the Andean khipu tradition tha iiiqpjqqged to represent sole, surviving record for South American Incan empire. It shows the systematic use of knots, cord colors, and structure to record information across many surviving objects. Its degree of readability depends on embodied interaction and learned conventions, but physical redundancies involving multiple material dimensions increases its chances of remaining at least partially decodable even after all modern language is lost.
|
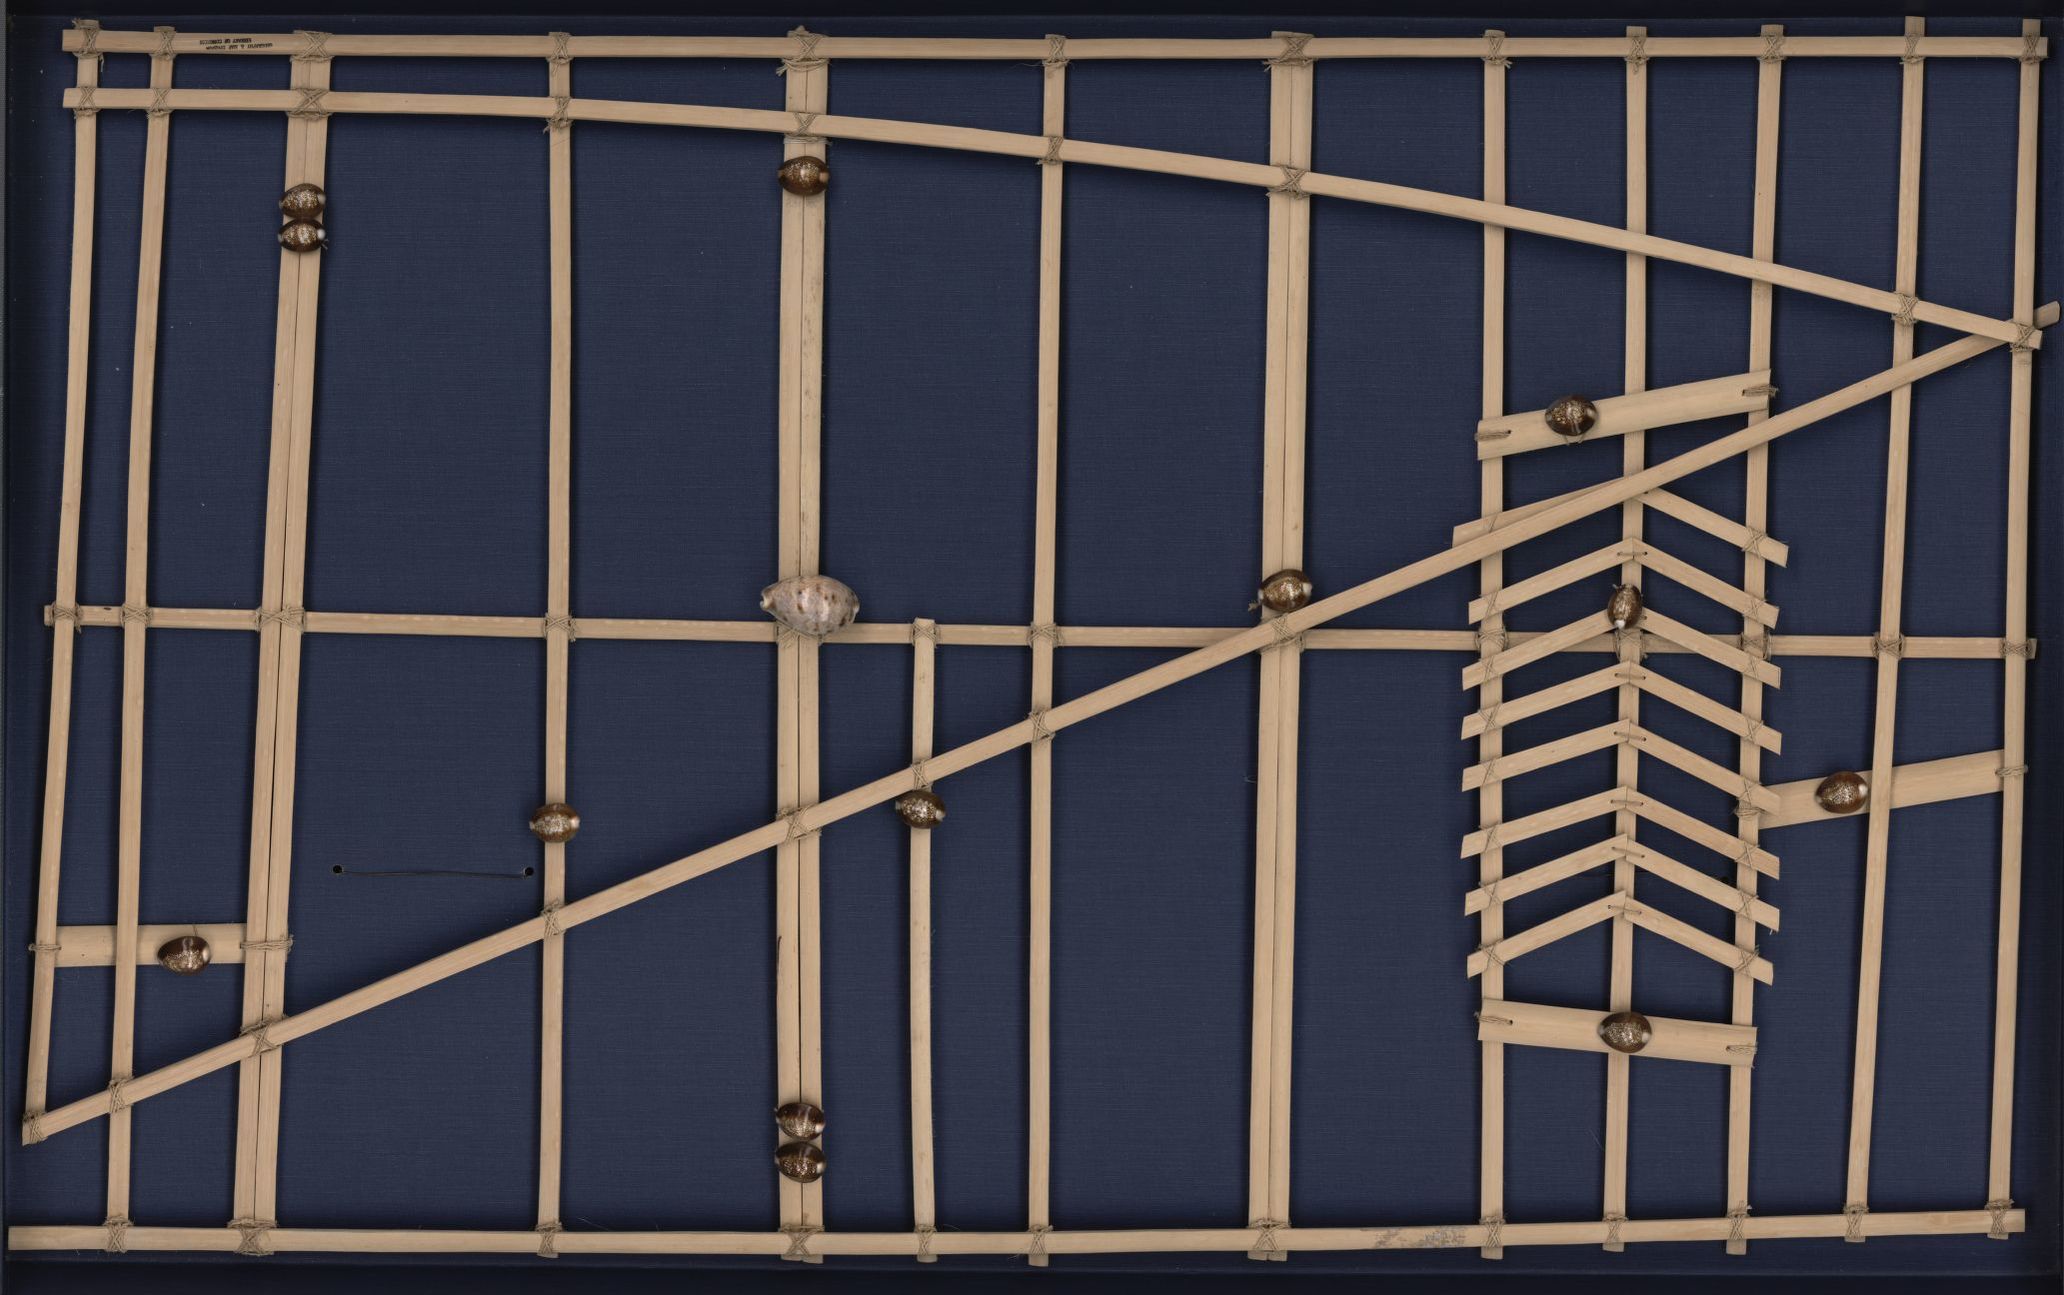
Astronomy as tabular prediction.
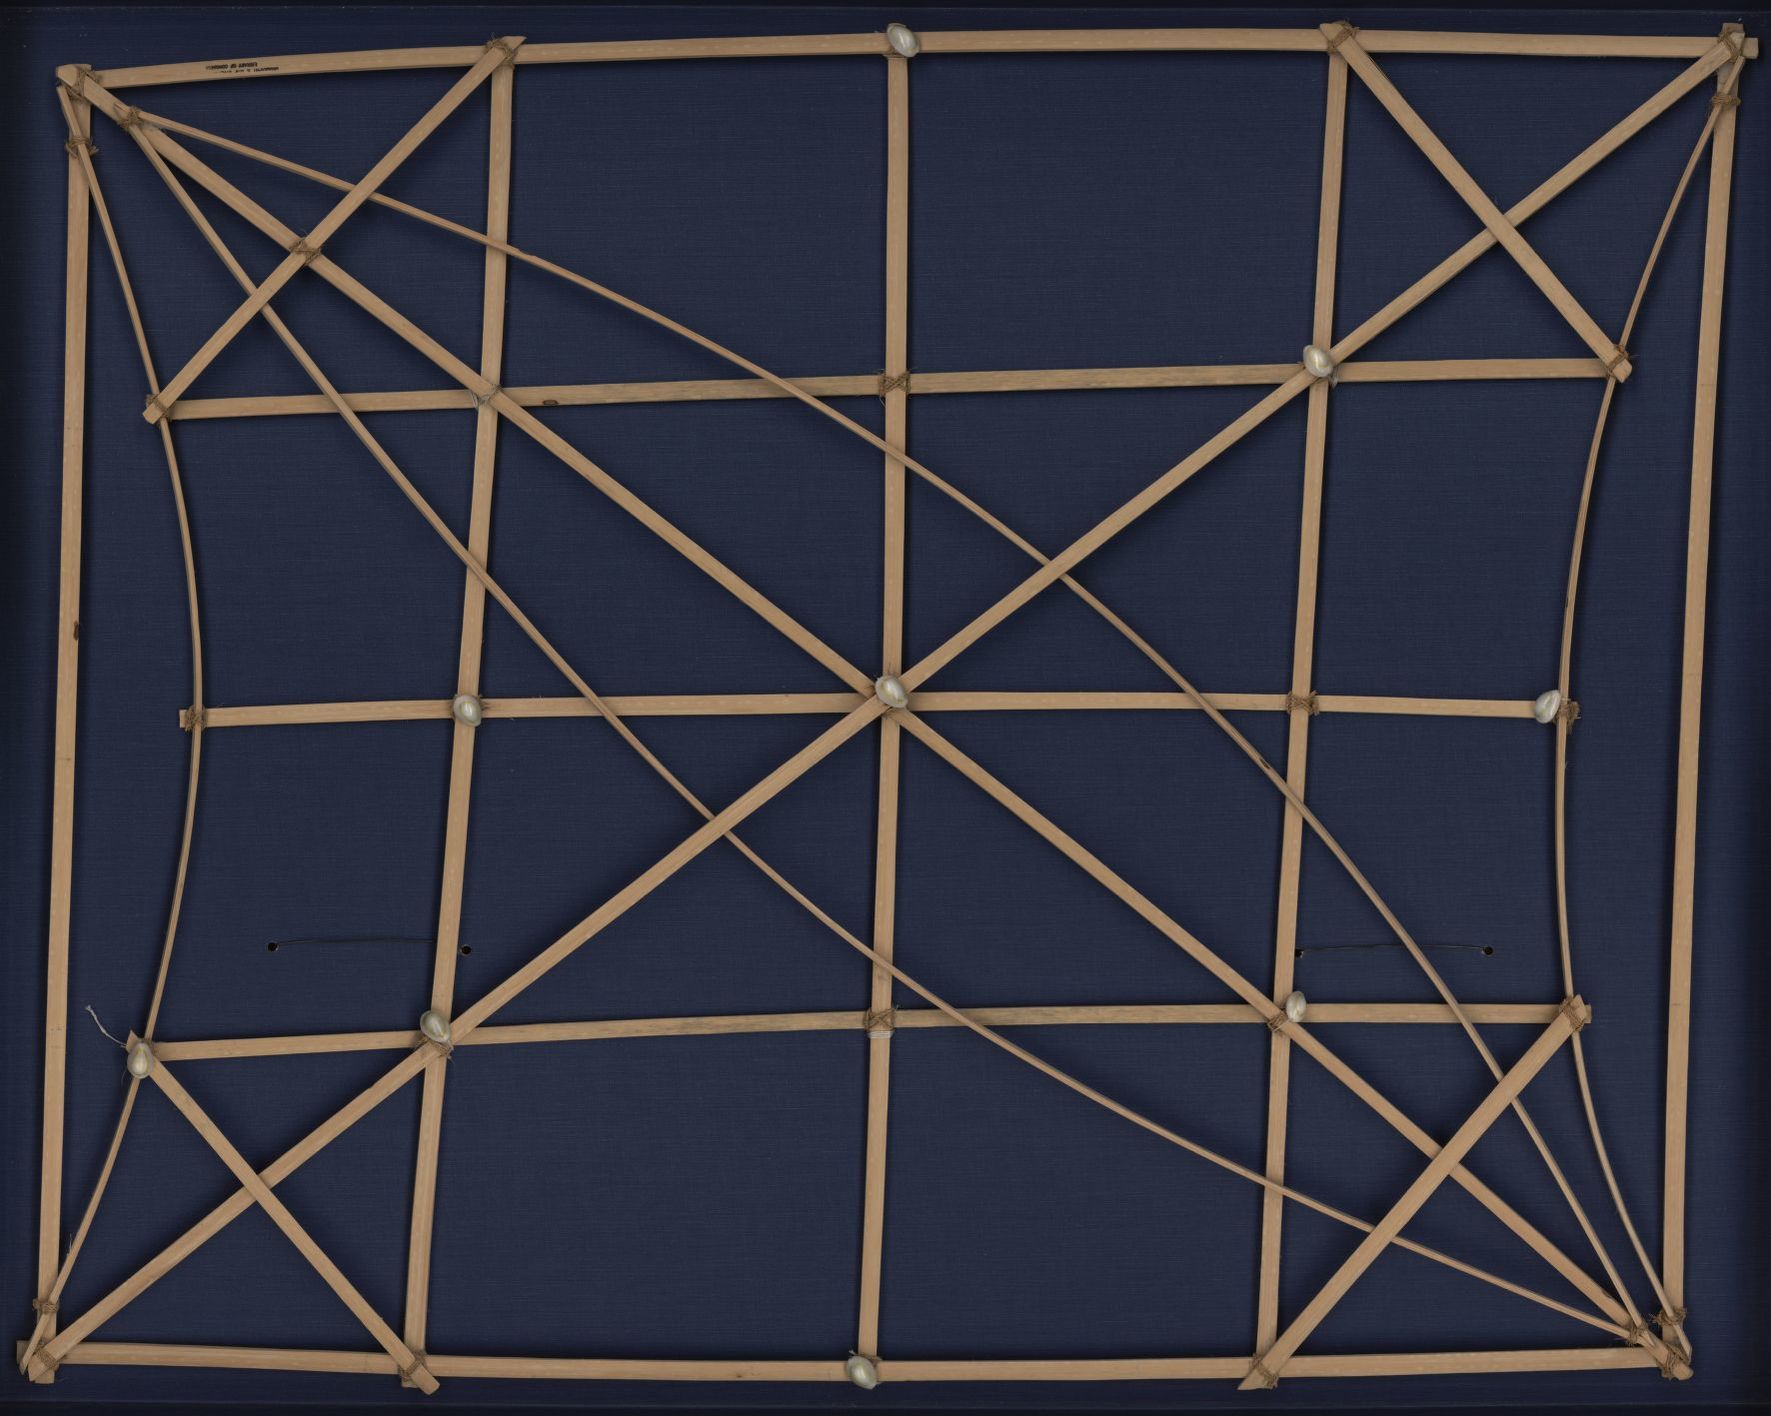
Marshallese Mattang stick chart. Source: Wikimedia Commons.Mattang
Dresden Codex Meddo eclipse table. Source: Wikimedia Commons.Meddo
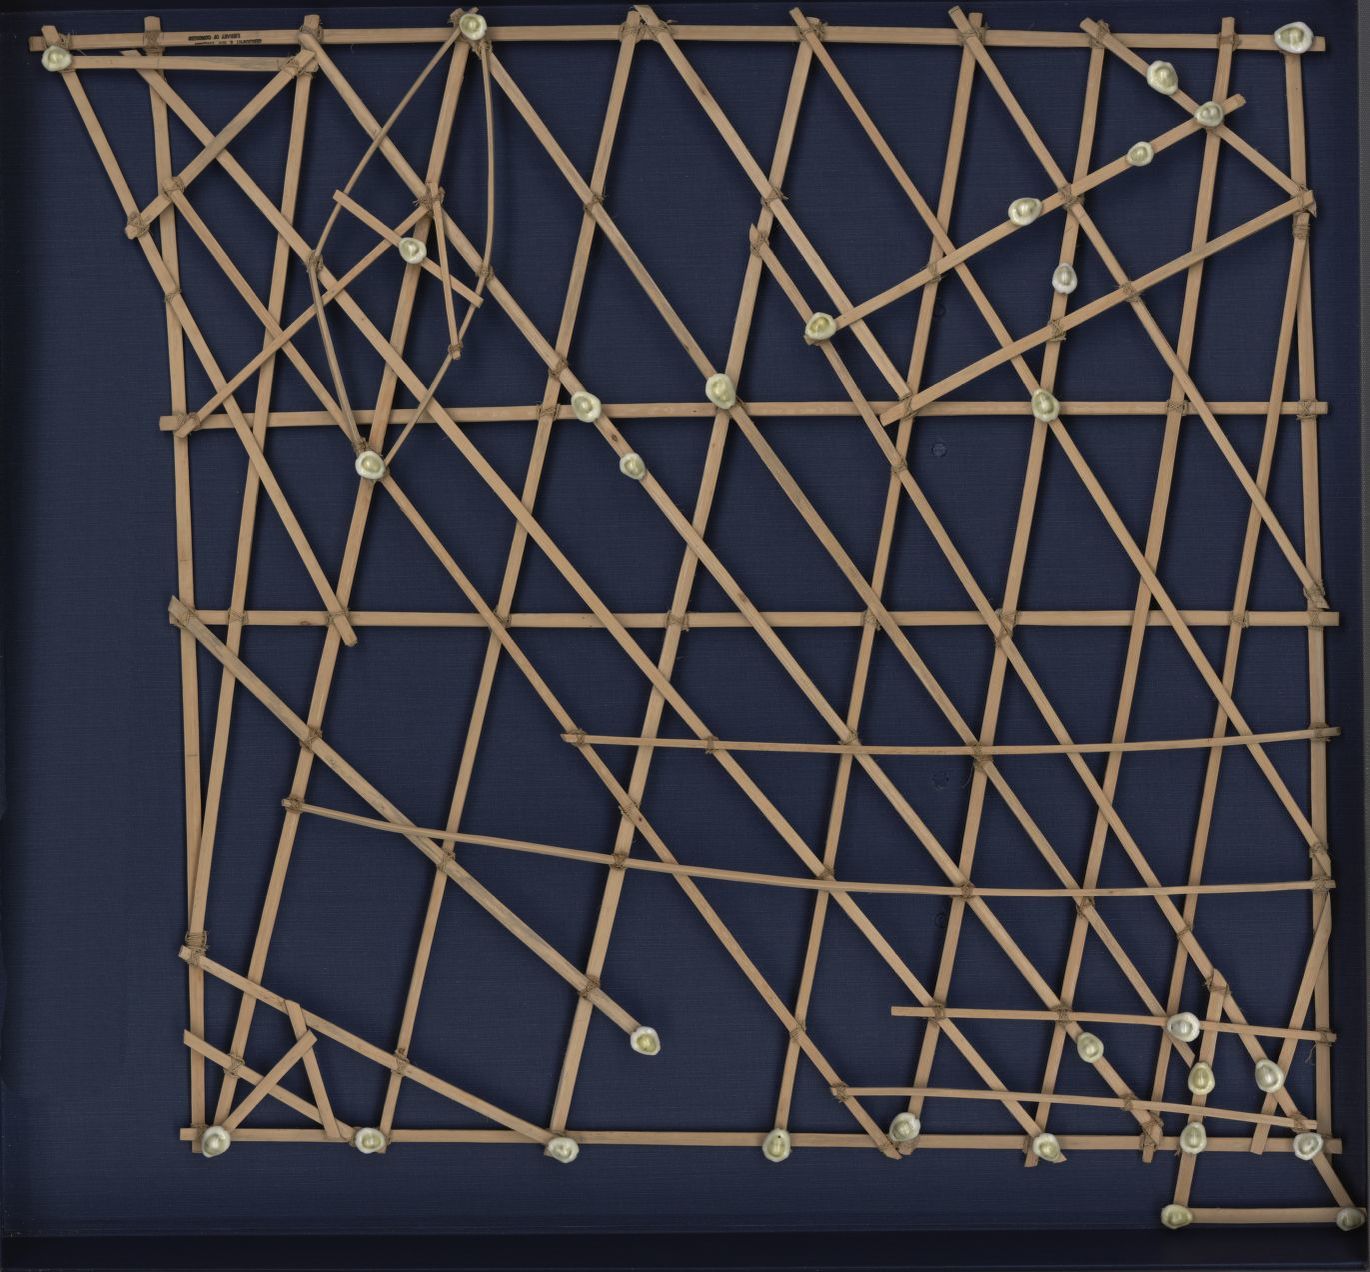
Marshallese Rebellib stick chart. Source: Wikimedia Commons.Rebellib
|
Recent scholarship analyzing the Dresden Codex eclipse table emphasizes structured sequences and corrections—evidence of a predictive, model-based information system. Even if glyph semantics are lost, periodic structure and error-correction marks may remain legible as “prediction machinery.” ====
Modern statistical graphics as “geometry of quantities”: The 18th–19th century European canon—time series and bars associated with entity["people","William Playfair","economist statistician"], polar area diagrams associated with entity["people","Florence Nightingale","nurse statistician"], and flow maps like entity["people","Charles Joseph Minard","civil engineer cartographer"]’s Napoleon campaign graphic—persist because they map quantities onto space in ways that don’t require language to notice patterns (surges, collapse, asymmetry, loss). citeturn1search1turn1search17turn1search11
Pictorial standardization: ISOTYPE, developed by entity["people","Otto Neurath","isotype pioneer"] and collaborators, explicitly aimed to make “social facts” pictorial through consistent symbol rules (e.g., quantity by repetition rather than scaling a pictogram). That design choice is a deep-time move: repetition is a high-likelihood universal. citeturn1search4turn1search8
image_group{"layout":"carousel","aspect_ratio":"1:1","query":["khipu quipu knotted cords museum object","Marshall Islands stick chart rebbilib navigational chart","Florence Nightingale polar area diagram coxcomb","Charles Minard Napoleon campaign flow map 1869","Voyager Golden Record cover diagram NASA"],"num_per_query":1}
2. Principles and affordances of visual systems that likely survive interpretation
A useful 30,000‑year heuristic is: what can be recovered from the artifact without shared language, shared UI conventions, or shared institutions? This pushes you toward perceptual/physical affordances.
2.1. Iconography, marks, and channels
In visualization theory, a recurring foundation is that information is encoded into marks (points/lines/areas) and channels (position, size, color, etc.). entity["people","Jacques Bertin","cartographer semiology"]’s account of “visual variables” (position, size, value/lightness, texture, color/hue, orientation, shape) is influential precisely because it ties design to perceptible differences rather than stylistic preference. citeturn10search14turn10search11
For persistence, the key is not which variables exist, but which are robustly decodable. The empirical “graphical perception” results associated with entity["people","William S. Cleveland","statistician"] and entity["people","Robert McGill","statistician"] support a long-standing rule of thumb: use position on aligned scales for accurate comparisons; treat area/angle encodings as high-risk for precise reading. citeturn0search2turn0search10
2.2. Color, salience, and ambiguity
Color offers fast grouping, but it is semantically unstable across cultures and biology. Cross-cultural work on basic color lexicons suggests partial universals (e.g., constrained evolution of “basic color terms”), but that does not guarantee shared symbolism (red = danger). citeturn7search2turn7search10 On top of that, a large fraction of people have red–green color vision deficiency (rates vary by population), so relying on red/green without redundancy is bad practice even in the short term. citeturn7search3turn7search11 From a 30k-year lens, color should be treated as accent + redundancy, not as the sole carrier of meaning.
2.3. Attention, feature binding, and data density
Attention research (feature integration theory, preattentive processing) implies that some single-feature targets can “pop out,” while multi-feature conjunctions demand focused attention and are easier to misread. citeturn5search0turn5search3 This matters for persistence: a future reader who does not know your conventions will fall back on what is visually salient.
Data density and small multiples matter because they let structure emerge without narration. entity["people","Edward R. Tufte","information design author"] argues for high-resolution, information-rich displays and “data-intense” micrographics (sparklines). citeturn0search5turn10search0 The deep-time translation of that idea is: pack evidence into the artifact itself, so interpretation does not depend on fetching external context.
2.4. Motion and interactivity
Interactivity is powerful now (“overview first, zoom and filter, then details on demand”), but it is preservation-hostile because it depends on executable environments. entity["people","Ben Shneiderman","hci researcher"]’s “visual information-seeking mantra” captures the cognitive logic of interactive exploration. citeturn6search0turn6search4 Yet from 30,000 years out, interaction is likely to be unreplayable unless you preserve software and environments.
Animation can clarify change when it preserves object constancy. Work on animated transitions (e.g., by entity["people","Jeffrey Heer","computer scientist visualization"] and collaborators) frames principles for using motion to help viewers track correspondences. citeturn4search1turn4search13 For deep time, treat animation as optional explanation, never as the only record.
flowchart LR
A[Data + intent] --> B[Encoding: marks & channels]
B --> C[Medium: print / static image / interactive system]
C --> D[Perception: salience, grouping, attention]
D --> E[Inference: patterns, comparisons, causality guesses]
E --> F[Memory + reuse]

C --> G{30k-year survival filters}
G --> H[Physics/geometry invariants<br/>e.g., position, topology, repetition]
G --> I[Cultural conventions<br/>e.g., reading direction, icon idioms]
G --> J[Tooling dependencies<br/>codecs, runtimes, servers]
G --> K[Context metadata<br/>legend, units, provenance]
3. Unusual, concise, elegant, and surprising techniques for 2026
This section emphasizes formats that communicate variable complexity—a quick gist at first glance, but deeper structure on inspection—while also noting what likely survives wordlessly.
Micro-visuals as “inline evidence”: Sparklines compress time-series shape into word-sized marks, allowing local evidence to travel with text/tables. They are unusually durable because a line’s shape reads as “variation over sequence” even without labels—though the meaning of the axis may be lost if you omit units. citeturn10search0 Caption: Sparkline: a minimal time-series signature embedded where reading happens. citeturn10search0
Horizon graphs and layered compression: Horizon graphs fold and color-layer a time series to increase density; experiments compare their accuracy tradeoffs as size shrinks. This is elegant but semantically fragile: without a legend explaining banding and mirroring, a future reader may see decorative stripes. citeturn4search2turn4search6 Caption: Horizon graph: sacrifices immediate intuitiveness to fit many time series into small vertical space. citeturn4search6
Glyphs that exploit human face-processing (risky but potent): Chernoff faces map multivariate dimensions to facial features; humans detect differences quickly, but the mapping is arbitrary and culturally loaded (what counts as “angry,” “healthy,” “normal”). The format can reveal clusters, yet meaning is highly likely to be lost without explicit mapping metadata. citeturn4search8 Caption: Chernoff faces: high-bandwidth perceptual channel; low inherent semantics. citeturn4search8
Flow maps and conservation metaphors: Sankey-like flows exploit a near-physical metaphor: width = quantity flow. They scale from gist (where is the mass?) to detail (specific paths), and survive surprisingly well if arrows and proportionality are clear. citeturn10search26turn1search11 Caption: Flow-width encoding: a “conservation law” picture that often reads even without language. citeturn10search26
Data physicalization (tactile redundancy): Physical representations can recruit touch, proprioception, and spatial memory. Research on “data physicalization” frames opportunities and challenges: physical artifacts can improve engagement and understanding in specific tasks, but are hard to version, store, and standardize. For deep time, physicalization can be an advantage if the object’s mapping is self-contained and labeled. citeturn4search11turn4search23 Caption: Physical chart/object: meaning partly in material constraints; preservation partly in material durability. citeturn4search11
Sonic and multimodal encodings: Sonification maps data to sound parameters, offering access where visuals fail and enabling detection of temporal patterns. The open-access entity["book","The Sonification Handbook","Hermann Hunt Neuhoff 2011"] documents the field’s foundations. citeturn9search11turn9search0 Multimodal designs may persist if paired with a durable specification of mapping and a playable audio format. Caption: Sonification: durable as audio files, but mapping semantics must be archived with it. citeturn9search0
AR/VR and immersive analytics (high power, high loss): Immersive analytics research explicitly explores embodied interaction for sensemaking, but surveys note both promise and practical constraints; preservation is especially fragile because it depends on hardware, runtimes, and interaction models. citeturn9search5turn9search16 Caption: Immersive analytics: cognitively rich; archivally brittle unless captured as re-playable states + video + specs. citeturn9search5
4. Constraints of long-term preservation that attack meaning first, not files
A harsh 30,000‑year view: bit-level survival is the easy part; semantic survival is the hard part. Preservation frameworks like OAIS describe responsibilities and concepts for maintaining information over time, but they do not guarantee interpretability unless you preserve representation information and designated-community assumptions. citeturn0search3turn0search15
4.1. Failure modes you should assume will happen
Format and platform obsolescence: Even widely used formats die when tooling dies. The entity["organization","Library of Congress","Washington, DC, US"] explicitly distinguishes “bit-level preservation” from “long-term usability,” warning that renderability depends on formats and dependencies. citeturn3search6turn3search3
Link rot and reference drift: Scholarly and legal communities have documented “reference rot” (links break; content changes). A well-known study behind Perma reports very high decay rates in cited URLs in legal and scholarly contexts—an empirical warning that “we’ll just link the source” is not preservation. citeturn11search35turn11search19
Software-dependent graphics: Interactive dashboards and web-native narratives often cannot be replayed without their software stack. Community efforts (emulation infrastructures, software preservation networks) exist precisely because this is a known, systemic risk. citeturn8search1turn8search2turn8search25
Silent corruption and authenticity: Fixity guidance treats bit rot and unnoticed alteration as routine threats, recommending checksum-based monitoring. citeturn8search3turn8search7 Replication strategies like “Lots Of Copies Keep Stuff Safe,” embodied by the entity["organization","LOCKSS Program","stanford libraries, ca, us"], reduce single-point failure. citeturn8search0turn8search12
4.2. Preservation-friendly containers and standards (practical bias, not ideology)
For web/native contexts, WARC (ISO 28500) exists to store payload + headers + metadata so future replay and auditing are plausible. citeturn6search14turn6search2 For documents, PDF/A (ISO 19005 family) constrains features (e.g., embedded fonts, no external dependencies) to improve long-term reproducibility. citeturn6search7turn6search19 For images and vectors, durability correlates with open, well-specified standards like PNG (ISO/IEC 15948) and SVG (W3C specification history), assuming you also preserve profiles, fonts, and rendering intent. citeturn11search17turn11search0turn11search24
Finally, if you must preserve software-dependent graphics, treat emulation as first-class: programs like EaaSI (led by entity["organization","Yale University Library","New Haven, CT, US"] partners) exist to scale emulated access to obsolete environments. citeturn8search1turn8search9
5. Practical user guide for designers and archivists in 2026
5.1. Guidelines
-
Make the graphic self-describing at three levels: Immediate: what is being compared; Operational: how to read it (legend, units, scales); Provenance: where data came from, when captured, and what transformations occurred. OAIS thinking is useful here: preservation needs representation information, not just files. citeturn0search3turn0search15
-
Default to encodings that survive perception without training: Prefer position on common scales, ordering, adjacency, and topology for core comparisons; use angles/areas only with redundancy and when precision is not the goal. citeturn0search2turn0search10
-
Assume color semantics will be misunderstood: Use color for grouping, not for single-channel meaning. Always add a non-color redundancy (shape, texture, labels), and account for widespread red–green deficiencies. citeturn7search3turn7search11
-
Exploit “gist-first, depth-later” structures: Favor designs that offer an immediate gestalt (trend, cluster, outlier) but preserve detail for inspection: small multiples, sparklines, and well-labeled dense displays do this well. citeturn10search0turn0search5
-
Use metaphors that are physically grounded, not culturally fashionable: Flow-width proportionality, containment, proximity, and symmetry are safer than memes, UI-specific iconography, or platform metaphors.
-
Treat motion as annotation, not as storage: If you animate, archive a static “keyframe set” and a written mapping/spec. Animated transitions can help interpretation now, but are too fragile to be the only record. citeturn4search1turn4search13
-
Preserve interaction in layers: If the work is interactive, capture: (a) a static canonical view, (b) a narrated screen recording of intended use, (c) exported data + schema, (d) code + build instructions, (e) an emulatable environment when feasible. This aligns with modern software preservation practice. citeturn8search2turn8search25turn8search3
-
Choose open, widely specified formats as the archival master: Use WARC for web captures, PDF/A for documents, PNG/TIFF for raster masters, SVG for vectors when you can control dependencies (fonts, external CSS/JS). citeturn6search14turn6search7turn11search17turn11search2
-
Bake in redundancy against cultural context loss: Include numeric anchors (example values), miniature keys, and a “Rosetta strip” that shows the same data in two encodings (e.g., table + plot). Redundancy is what future intelligences will use to triangulate meaning.
5.2. Likely to persist vs likely to be lost
| Likely to Persist (with reasons) | Likely to Be Lost (with reasons) | |---|---| | Spatial comparisons using aligned position — leverages geometry and robust perception. citeturn0search2 | Chart-type conventions without legends — “this is a boxplot” or “this is a violin plot” is culturally learned; without explanation it becomes abstract decoration. citeturn10search4 | | Repetition for quantity (tally/pictogram counts) — counting/accumulation is near-universal; ISOTYPE formalized this. citeturn1search4turn1search8 | Color-as-semantics (red=bad/green=good) — culturally variable and biologically inaccessible to many viewers; also unstable across display media. citeturn7search3 | | Topology and networks (nodes/links), physical lattices — structure survives even if labels don’t (e.g., stick charts). citeturn2search7turn2search4 | Emoji/icon idioms and UI glyphs — meaning depends on platform-era conventions and often short-lived pop culture. | | Physically grounded metaphors (flow width, containment, proximity) — can be reverse-engineered from invariants. citeturn10search26 | Highly compressed encodings without decoding rules (e.g., horizon graphs without band explanation) — compactness increases dependence on conventions. citeturn4search6 | | Self-contained standards-focused artifacts (PDF/A, WARC) + metadata — engineered for long-term re-rendering and context. citeturn6search7turn6search14 | Purely interactive, server-backed dashboards — dependencies on runtimes, APIs, and hardware; high probability of irrecoverable behavior. citeturn8search1turn8search2 | | Redundant multi-modal records (image + text + data + units) — multiple hooks let future readers triangulate meaning. citeturn0search15 | Link-only citations to web sources — documented link rot/content drift makes “just link it” a predictable failure. citeturn11search35turn11search19 |
5.3. Speculative 30,000‑year interpretation scenarios
Scenario: The archive as a fossilized UI. A future intelligence recovers a WARC of a 2026 web-based dashboard but cannot execute the JavaScript environment. The only intelligible parts are static thumbnails, embedded CSV exports, and any preserved “about/legend” text. If you archived interaction only as behavior (code), it is dead; if you archived it as state snapshots + narrative screen capture + data schema, it becomes reconstructible. citeturn6search14turn8search25
Scenario: Physics beats culture. They find the entity["album","Voyager Golden Record","1977"] cover diagrams from entity["organization","NASA","us space agency, washington, dc"] explaining playback and Earth’s location via the hydrogen hyperfine transition and pulsar map. Even if “humans” are unknown, the artifact anchors units to physical constants and uses redundancy—a deliberate attempt at wordless scientific communication. This is a template for deep-time infographics: reference to invariants + explicit decode steps. citeturn3search0turn3search14
Scenario: Fear without semantics. They discover nuclear-waste warning research (designed for ~10,000 years) recommending multi-level messages: immediate “something dangerous,” then progressively more detailed explanations. The lesson is uncomfortable but practical: deep-time messaging often needs an affective layer (salience/avoidance) plus a technical layer (explanation), because one without the other can fail. citeturn3search8turn3search2